TIPS vs I-Bonds vs Treasuries: Real Yield + Breakeven Inflation Explained
TIPS vs I-Bonds vs Treasuries: The Simple Guide to Real Yields + Breakeven Inflation
Everything you need to know about inflation-protected investments—real yields, breakeven rates, inflation swaps, and the tax trap most investors miss. Updated with today’s surprising CPI results.
Nov CPI YoY
Breaking: November CPI Released Today. This morning’s CPI report came in way cooler than anyone expected. Headline inflation hit 2.7% YoY versus the 3.1% consensus, and core CPI dropped to 2.6%—the lowest reading since March 2021. The 10-year Treasury yield fell about 3 basis points to 4.12% on the news, and the Nasdaq jumped nearly 2%.[1]
But here’s the thing: there’s a giant asterisk on these numbers. And if you’re making decisions about TIPS, I-Bonds, or Treasuries based on this report, you need to understand why most economists are telling us to take it with, as CNBC put it, “the entire salt shaker.”[2]
TIPS vs I Bonds, which one actually protects your purchasing power without playing the Fed guessing game? If you’re trying to protect your purchasing power without playing the Fed guessing game, you’ve probably stumbled across three confusing options: TIPS, I-Bonds, and nominal Treasuries. Each promises something different—guaranteed real returns, inflation protection, or predictable income—but understanding which one fits your situation requires cutting through a lot of jargon.
Let’s walk through exactly how real yields work, what breakeven inflation actually tells you (and what it doesn’t), how institutional investors use inflation swaps to read market expectations, and which instrument makes sense for your time horizon, tax situation, and risk tolerance. But first, let’s talk about the elephant in the room.
The October That Wasn’t: Why This CPI Report Is Different
Before we dive into TIPS mechanics and breakeven calculations, we need to address something that’s never happened before in modern U.S. economic history: the Bureau of Labor Statistics just released an inflation report with a two-month gap in the data.
The 43-day government shutdown that ran from October 1 through November 12, 2025—the longest in U.S. history—didn’t just delay some paperwork. It created a black hole in our inflation data that affects everything from TIPS index ratios to Fed policy decisions.[3]
No October CPI at all. The BLS couldn’t collect the price data, and they can’t go back and recreate it. For a few indexes, they cobbled together some “nonsurvey data sources,” but for most categories, October 2025 simply doesn’t exist in the official record.
Half a November. Data collection didn’t restart until November 14, so the BLS only gathered prices for the back half of the month. That means this report likely captured more Black Friday discounting than a typical November reading would.[2]
No month-over-month changes. Without October, there’s no baseline for calculating how much prices moved in November. The BLS reported a 0.2% two-month change from September to November, which works out to about 0.1% per month—but that’s an average, not actual data.
What This Means for Inflation-Protected Investors
Here’s where it gets interesting if you own TIPS or you’re considering buying them. TIPS principal adjustments are based on the CPI-U index. The Treasury publishes daily index ratios that determine exactly how much your principal has grown. But what happens when there’s no October CPI?
The Cleveland Fed had to use their own “inflation nowcasting” estimate to fill the gap for October when running their inflation expectations model.[4] And the Treasury had to calculate TIPS index ratios using a synthetic October number. As TIPS Watch noted, “the inflation index of 1.00653 includes the result of the ‘synthetic’ inflation calculation for October 2025… that number is almost certainly slightly off target.”[5]
The good news? This should autocorrect as future inflation reports come in. The bad news? If you bought or sold TIPS during this period, your transaction was priced on an approximation, not actual inflation data.
Why Economists Don’t Trust Today’s Numbers
I don’t want to be a buzzkill about what looks like fantastic inflation news on the surface. But when RSM’s chief economist calls this “one flawed report” and Capital Economics says they’re “slightly suspicious of some of these numbers,” that’s not typical post-CPI commentary.[2]
The core concern is that shelter inflation—which makes up about a third of the CPI weighting—dropped to 3.0% from 3.6% in September. That kind of sudden deceleration in the stickiest component of inflation is, as Capital Economics put it, “very unusual, at least outside of a recession.”[6]
“Today’s low inflation reading won’t move the needle for the Fed given how noisy the data is. The canceling of the October report makes month-on-month comparisons impossible… The Fed will instead focus on the December CPI released in mid-January.”
— Kay Haigh, Goldman Sachs Asset Management[7]
Morgan Stanley’s economists warned that inflation “could see reacceleration in December” given how the BLS processed the report without October data.[8] We’re essentially flying blind until the January release gives us a cleaner picture.
TIPS vs I Bonds: Quick Answers for Your Situation
Now that we’ve got the data quality caveats out of the way, let’s get to what you actually came here for.
At a Glance:
• Best for inflation hedge with guaranteed principal floor at maturity: TIPS (if you can tolerate price swings before maturity)[9]
• Best “set-and-forget” inflation-linked savings product: I-Bonds (12-month lock, penalty if redeemed under 5 years)[10]
• Best if inflation falls and you want a known nominal yield: Nominal Treasuries
• Best for reading institutional inflation expectations: Inflation swaps (zero-coupon and year-on-year)
TIPS vs I Bonds vs Treasuries: What Each Actually Is
What Are TIPS (Treasury Inflation-Protected Securities)?
TIPS are U.S. Treasury bonds where the principal adjusts with inflation as measured by the Consumer Price Index for All Urban Consumers (CPI-U). The coupon rate stays fixed, but because it’s applied to an inflation-adjusted principal, your interest payments effectively grow with inflation.[9]
Here’s the critical detail most investors miss: at maturity, you receive the greater of your adjusted principal or your original principal. This built-in deflation floor means you’re guaranteed to get back at least what you invested, even if we experience deflation during the bond’s term.[11]
TIPS are issued in 5-year, 10-year, and 30-year maturities. The Treasury publishes daily index ratios that show exactly how your principal is adjusting—though as we discussed, the recent shutdown created some noise in those calculations.
What Are I-Bonds (Series I Savings Bonds)?
I-Bonds combine two components: a fixed rate (locked in when you buy, currently 0.90%) and a variable inflation rate that resets every six months based on CPI-U. The current composite rate is 4.03% for bonds issued November 2025 through April 2026.[10]
Composite Rate = Fixed Rate + (2 × Semiannual Inflation Rate) + (Fixed Rate × Semiannual Inflation Rate)
Current: 0.90% + (2 × 1.56%) + (0.90% × 1.56%) = 4.03%
The rules that matter for I-Bonds—and I really can’t stress these enough:
• 12-month lock-up: You cannot redeem for the first year. Period. Not for emergencies, not for anything.
• 3-month interest penalty: If redeemed before 5 years, you forfeit the last 3 months of interest[10]
• $10,000 annual limit: Per person, per calendar year (paper bonds via tax refund ended January 1, 2025)[12]
• No secondary market: You can’t sell I-Bonds to other investors—you can only redeem them with Treasury
That 12-month lock is why I-Bonds aren’t a true emergency fund despite what some financial influencers claim. If you need money in month six, it’s simply not available.
What Are Nominal Treasuries?
Nominal Treasuries are the “plain vanilla” government bonds most investors know. They pay a fixed coupon rate on a fixed principal—no inflation adjustment whatsoever. Your “real” return (after inflation) depends entirely on how inflation evolves during the holding period.
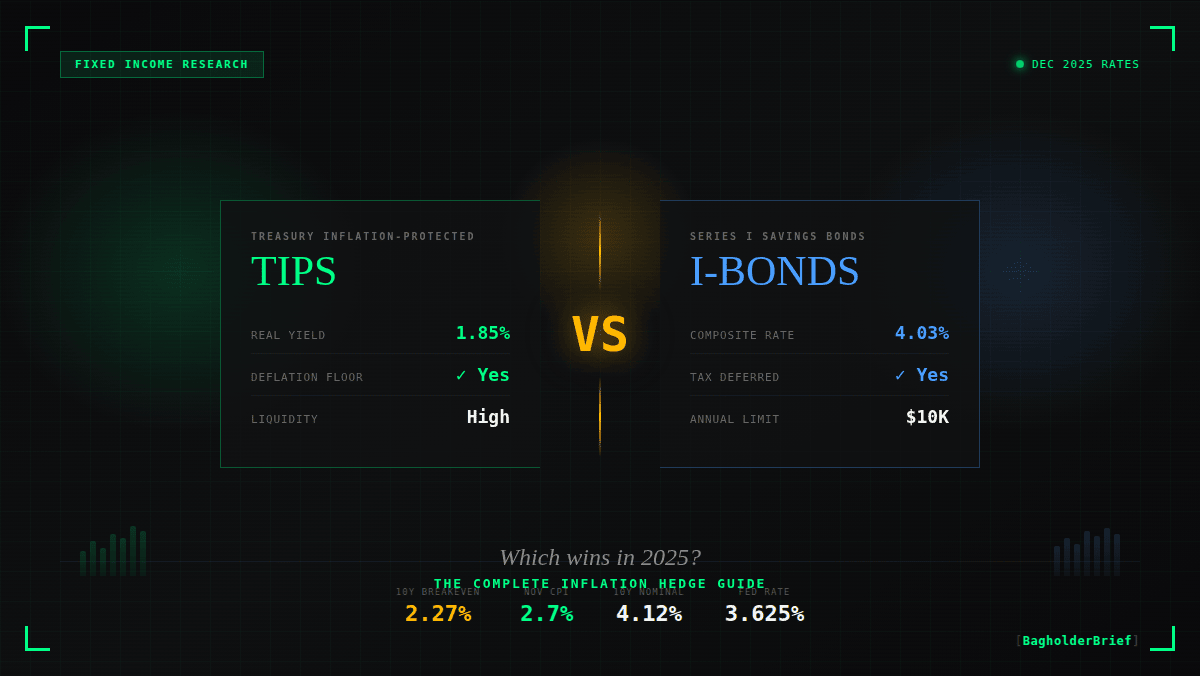
The 10-year Treasury currently yields approximately 4.12% after today’s rally.[1] If inflation averages 2.27% over that period (the current breakeven), your real return would be roughly 1.85%—basically identical to what TIPS are offering directly.
Real Yield: The Concept That Unlocks Everything
Nominal Yield vs. Real Yield (Plain English)
Nominal yield is the stated interest rate—what you see quoted on CNBC. Real yield is your return after subtracting inflation. It represents what you actually earn in purchasing power.
When you buy TIPS, the yield you see is the real yield. That’s the whole point—TIPS quote real yields because inflation adjustments are built into the principal. When you buy a nominal Treasury, you’re seeing a nominal yield, and your real return is a guess based on future inflation.
Why Real Yield Matters More Than “Headline CPI”
Too many investors obsess over monthly CPI prints while ignoring real yields. Here’s the reality: real yield is the market’s pricing of inflation-adjusted returns across different time horizons. A positive real yield means you’re earning purchasing power; a negative real yield means inflation is eating your returns even before taxes.
Today’s 10-year TIPS real yield of approximately 1.85% is historically attractive—we spent much of 2020-2021 in negative real yield territory.[13] Positive real yields give investors a genuine opportunity to grow purchasing power with minimal credit risk.
Breakeven Inflation (TIPS Spread): What It Is and What It Isn’t
The Definition (Simple Math)
Breakeven inflation is derived from the difference between nominal Treasury yields and TIPS real yields of the same maturity:[14]
Breakeven Inflation = Nominal Treasury Yield − TIPS Real Yield
Current 10-Year: 4.12% − 1.85% = 2.27% expected average inflation
The breakeven rate tells you the inflation level at which TIPS and nominal Treasuries would deliver identical returns. If actual inflation exceeds the breakeven, TIPS win. If inflation comes in below the breakeven, nominal Treasuries win.
What Breakeven Inflation Can Mislead You On
The breakeven rate is not a pure market forecast of inflation. It includes other factors that can muddy the signal:[15]
• Liquidity premium: TIPS are less liquid than nominal Treasuries, so they often trade at a slight discount (lower price = higher yield)
• Inflation risk premium: Investors may pay a premium for inflation protection, pushing TIPS prices up (lower yield) and widening breakevens
• Technical factors: Supply/demand imbalances, pension fund hedging flows, and seasonal patterns can all distort breakevens
Use breakevens as a signal, not a forecast. The current 5-year breakeven of around 2.32% and 10-year breakeven of 2.27% suggest markets expect inflation to remain moderately above the Fed’s 2% target—though as TIPS Watch pointed out, the bond market seems skeptical of the Fed’s optimistic 2026-2028 inflation projections.[5]
Reading Market Expectations: How Inflation Swaps Work
Beyond TIPS breakevens, institutional investors use inflation swaps to both hedge inflation risk and gauge market expectations. Understanding these instruments gives you a window into how pension funds, insurers, and sophisticated traders think about inflation.
Zero-Coupon Inflation Swaps (ZCIS)
A zero-coupon inflation swap is a contract between two parties where:[16]
Fixed ↔ CPI Return
At maturity: Fixed leg pays (1+K)^T − 1, Inflation leg pays (CPI_T/CPI_0) − 1
No payments occur until maturity—everything settles in a single exchange. The “par swap rate” (K) that makes both legs equal at inception represents the market’s implied inflation expectation for that tenor.
Year-on-Year Inflation Swaps
Year-on-year (YoY) inflation swaps make periodic payments based on the realized 12-month inflation rate. These are useful for matching cash flows to inflation-linked liabilities, such as pension benefits that adjust annually with cost-of-living increases.[16]
Why Swaps Matter for Individual Investors
While you likely won’t trade inflation swaps directly, understanding them helps you:
• Interpret breakevens more accurately: Swap rates and TIPS breakevens should generally align, but divergences can signal liquidity issues or positioning extremes
• Understand institutional flows: Heavy pension fund hedging via swaps can push breakevens wider than “pure” inflation expectations would suggest
• Access forward expectations: The 5-year, 5-year forward inflation rate (currently around 2.18%) tells you what markets expect inflation to average from 2030-2035[17]
The Cleveland Fed’s inflation expectations model combines TIPS data, inflation swaps, and survey measures to produce some of the most comprehensive estimates available to the public—though they had to improvise for October’s missing data.[4]
TIPS vs I Bonds: When Each One Wins (Scenario Framework)
Than Expected
TIPS
Principal adjusts up
or Deflation
Nominals
Fixed payments gain value
Within 12 Months
Nominals
I-Bonds locked
Long-Term Savings
I-Bonds
Tax-deferred growth
TIPS ETFs vs. Individual TIPS: A Critical Distinction
A lot of investors assume that buying a TIPS ETF like TIP or SCHP is equivalent to holding individual TIPS. It’s not, and the difference matters more than most people realize.
| Feature | Individual TIPS | TIPS ETFs |
|---|---|---|
| Deflation Floor | Guaranteed at maturity | No—fund never “matures” |
| Interest Rate Risk | Eliminated if held to maturity | Perpetual; NAV fluctuates |
| Known Real Yield | Locked in at purchase | Varies as holdings roll |
| Liquidity | Can sell early (with price risk) | Excellent intraday liquidity |
| Minimum Investment | $100 at TreasuryDirect | Price of one share (~$100) |
If you’re buying TIPS for the deflation floor and guaranteed real yield, individual bonds held to maturity are the only way to get those features. TIPS ETFs are convenient, but they’re a different animal—more like a floating-rate inflation-linked bond fund than a true inflation hedge.[18]
The Tax Trap: Phantom Income on TIPS
This is where TIPS get genuinely annoying for taxable account holders, and I don’t want to sugarcoat it.
⚠️ Phantom Income Warning: When TIPS principal adjusts upward for inflation, you owe taxes on that increase immediately—even though you don’t receive the money until you sell or the bond matures. In high-inflation years, this can create negative cash flow: you’re paying taxes on “income” that exists only on paper.[19]
The IRS requires TIPS holders to report inflation adjustments as ordinary income annually (reported on Form 1099-OID under CFR 1.1275-7). In a year with 5% inflation, you might owe taxes on principal growth that you won’t see for years.
The practical solution? Hold TIPS in tax-advantaged accounts (IRAs, 401(k)s) whenever possible. If that’s not an option, individual TIPS held to maturity at least let you plan for the tax hit, while TIPS ETFs add another layer of unpredictability.
I-Bonds don’t have this problem—taxes are deferred until redemption. It’s one of their underappreciated advantages over TIPS for taxable investors.
How to Buy: A Quick Practical Guide
TIPS
• TreasuryDirect: Buy at auction (no fee, $100 minimum)
• Brokerage: Buy on secondary market (small bid-ask spread)
• ETFs: TIP, SCHP, VTIP for broad exposure (expense ratios 0.03%-0.19%)
I-Bonds
• TreasuryDirect only: No brokerage option exists
• $10,000 annual limit: Per Social Security Number
• Paper bonds via tax refund: This option ended January 1, 2025[12]
Nominal Treasuries
• TreasuryDirect: Auction purchases
• Any brokerage: Highly liquid secondary market
• ETFs/Mutual Funds: Countless options across the duration spectrum
TIPS vs I Bonds: Complete Comparison Table
As of December 18, 2025
| Feature | TIPS | I-Bonds | Nominals |
|---|---|---|---|
| Inflation Protection | Principal adjusts | Rate adjusts | None |
| Deflation Protection | Floor at par | Rate can’t go below 0% | Fixed payments gain value |
| Maturities | 5, 10, 30 years | 30yr (redeemable after 1yr) | 4 weeks to 30 years |
| Purchase Limit | None | $10,000/year | None |
| Liquidity | Secondary market | 12-month lock | Highly liquid |
| Tax Treatment | Phantom income | Deferred | Coupon taxed when received |
| Current Yield/Rate | ~1.85% real | 4.03% composite | ~4.12% nominal (10Y) |
Common Mistakes to Avoid
After years of watching investors trip over the same issues, here are the pitfalls I see most often:
• Using I-Bonds as an emergency fund: The 12-month lock-up is absolute. If you might need the money within a year, I-Bonds are the wrong vehicle.
• Assuming TIPS ETFs have a deflation floor: They don’t. The fund never matures, so you never get that protection.
• Ignoring phantom income taxes: TIPS in taxable accounts can create real cash flow problems in high-inflation environments.
• Overreacting to single CPI prints: Today’s report is a perfect example. One data point—especially a compromised one—shouldn’t drive major allocation decisions.
• Comparing I-Bond composite rates to Treasury yields directly: I-Bonds have the 12-month lock and 5-year penalty. That illiquidity needs to be factored in.
What Today’s CPI Means Going Forward
So where does this leave inflation-protected investors after today’s surprise?
The honest answer is: we need to wait for cleaner data. The December CPI, scheduled for release on January 13, 2026, will be the first report with a full month of normal data collection. Until then, here’s what we know:
• The bond market rallied but remains skeptical—10-year yields only fell 3 basis points despite a massive beat on expectations
• Breakevens haven’t collapsed—markets still expect inflation above 2% over the next decade
• The Fed is in “wait and see” mode—as Goldman noted, this report won’t change their December-January calculus much
• Real yields remain attractive—around 1.85% on the 10-year TIPS is still historically solid
For TIPS holders specifically, the synthetic October index ratio means your principal adjustments during this period are approximations. They should autocorrect over the next few months as clean data comes in. It’s not a reason to sell, but it’s worth understanding.
Food prices are still elevated (coffee up 19%, beef up 21%), and tariff effects continue to work through the system.[2] The underlying inflation story hasn’t fundamentally changed just because one disrupted report came in cool.
Bottom Line
There’s no single “best” inflation-protected investment—only the right one for your situation. TIPS offer guaranteed real yields and a deflation floor if held to maturity, but come with phantom income tax headaches. I-Bonds provide tax-deferred growth and simplicity, but with strict liquidity constraints and purchase limits. Nominal Treasuries win when inflation undershoots expectations.
The sophisticated approach? Use all three strategically. Build an I-Bond allocation for tax-deferred savings you won’t need for at least a year. Use individual TIPS ladders for known future liabilities in tax-advantaged accounts. Keep nominal Treasuries for flexibility and diversification against the deflation scenario everyone forgets to hedge.
Today’s CPI report looks great on the surface, but the data quality issues mean we’re essentially operating with one hand tied behind our backs until January. Real yields are positive, breakevens are reasonable, and you have tools to protect your purchasing power. Just don’t make major moves based on what might turn out to be statistical noise.
References & Sources
- CNBC. “10-year Treasury yield slides after much lighter November inflation than expected.” cnbc.com, December 18, 2025.
- CNBC. “Here’s the inflation breakdown for November 2025 — in one chart.” cnbc.com, December 18, 2025.
- U.S. Bureau of Labor Statistics. “Consumer Price Index – November 2025.” bls.gov, December 18, 2025.
- Federal Reserve Bank of Cleveland. “Inflation Expectations.” clevelandfed.org, December 2025.
- TIPS Watch. “Treasury Inflation-Protected Securities.” tipswatch.com, December 2025.
- CBS News. “CPI report shows inflation rose at a 2.7% annual pace in November, cooler than expected.” cbsnews.com, December 18, 2025.
- Fox Business. “November CPI: Inflation remained elevated as Fed weighs rate cut pause.” foxbusiness.com, December 18, 2025.
- NBC News. “Inflation falls to 2.7% as slower housing and food increases offset a surge in electricity.” nbcnews.com, December 18, 2025.
- U.S. Department of the Treasury. “Treasury Inflation-Protected Securities (TIPS).” treasurydirect.gov
- U.S. Department of the Treasury. “I Bonds Interest Rates.” treasurydirect.gov, November 2025.
- NISA Investment Advisors. “TIPS (Treasury Inflation Protected Securities) – Primer.” nisa.com, May 2025.
- U.S. Department of the Treasury. “Fiscal Service Announces New Savings Bonds Rates.” treasurydirect.gov, November 1, 2025.
- Trading Economics. “United States 10 Year TIPS Yield.” tradingeconomics.com, December 2025.
- Federal Reserve Bank of St. Louis. “10-Year Breakeven Inflation Rate (T10YIE).” fred.stlouisfed.org
- JPMorgan Chase Institute. “Reading Inflation Expectations from the Treasury Market.” jpmorganchase.com
- Wikipedia. “Inflation swap.” wikipedia.org, October 2025.
- Federal Reserve Bank of St. Louis. “5-Year, 5-Year Forward Inflation Expectation Rate (T5YIFR).” fred.stlouisfed.org
- Charles Schwab. “TIPS and Inflation: What to Know Now.” schwab.com, August 2025.
- Raymond James. “TIPS Treasury Inflation Protected Securities – Taxable Bonds.” raymondjames.com
Disclaimer: This article is for informational purposes only and does not constitute investment advice. Past performance is not indicative of future results. Always conduct your own research before making investment decisions. BagholderBrief is not a registered investment advisor. For our Full Policy -> Legal