Silver Shatters Records: The Historic 2025 Rally That More Than Doubled the ‘Devil’s Metal’
Silver Shatters Records: The Historic 2025 Rally That More Than Doubled the ‘Devil’s Metal’
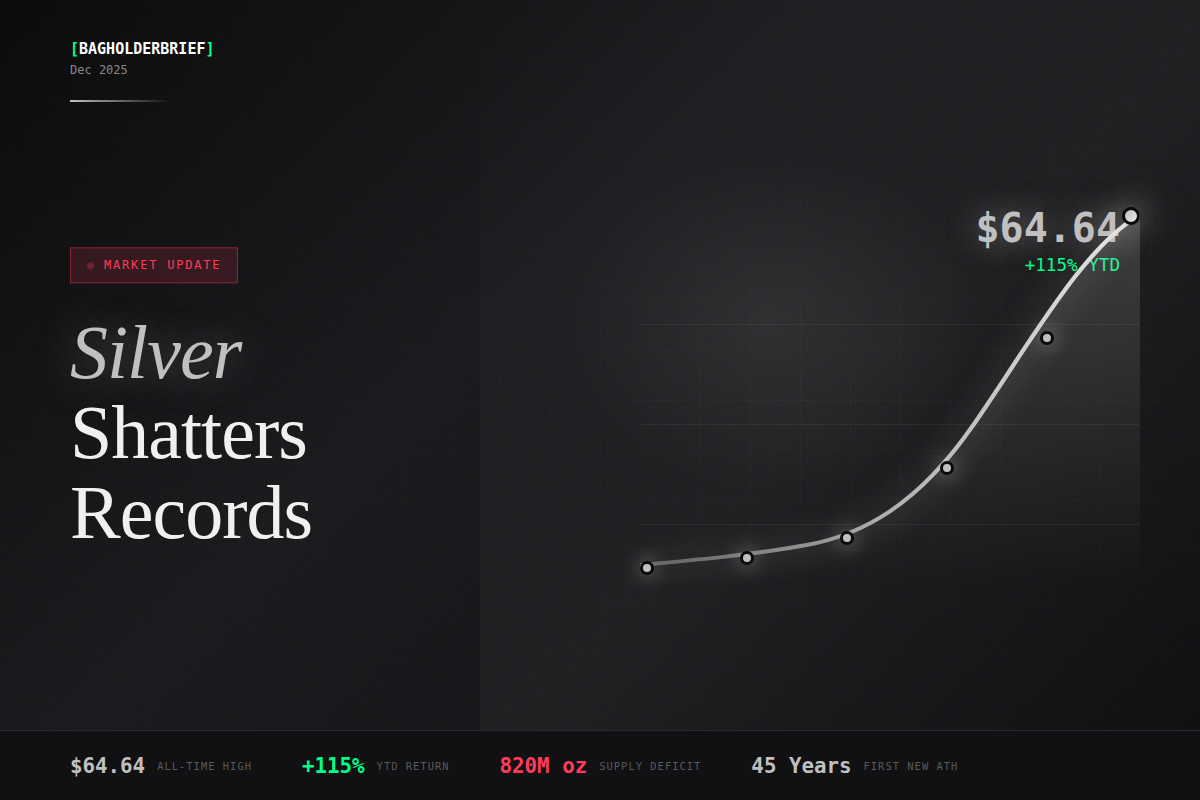
The silver price in 2025 has exploded past $64 to all-time highs, gaining over 115% year-to-date and outpacing gold’s historic run. Here’s what’s driving the unprecedented surge and whether $100 silver is next.
Spot Silver
Silver just did something it hasn’t done in 45 years: it broke its all-time high—and then kept going. The precious metal smashed through $60 per ounce for the first time ever on December 9, then surged to a record $64.64 by December 12, obliterating the 1980 peak that had stood untouched for nearly half a century.[1]
With gains exceeding 115% year-to-date, the silver price in 2025 has more than doubled, dramatically outpacing even gold’s impressive 60% rally.[2] This isn’t just another commodity cycle—it’s a structural repricing of a metal that sits at the intersection of the green energy revolution, monetary policy shifts, and a supply crisis years in the making.
🏆 New All-Time High Reached: On December 11, 2025, spot silver hit $64.31—surpassing the previous record of $49.95 set during the Hunt Brothers squeeze of January 1980. This marks the first new all-time high in 45 years.[3]
Silver Price 2025: From $60 to $64 in Days
The week of December 9-13, 2025 will go down in silver market history. On Monday, December 9, spot silver broke through the $60 barrier, touching $60.72—a psychological milestone that sent shockwaves through commodities markets.[4]
The Federal Reserve’s December 10 meeting added fuel to the fire. The Fed delivered its third rate cut of 2025, lowering rates by 25 basis points, and announced it would begin purchasing short-term Treasuries at a pace of $40 billion per month—a move some traders interpreted as a return to quantitative easing.[5]
By December 11, silver had rocketed to $64.31, setting a fresh all-time high. The metal briefly touched $64.64 on December 12 before profit-taking brought prices back to around $61.70.[1]
“This isn’t a collapse in the bull story—at least not yet. It’s a volatility event in a market that has been moving in unusually large steps. Even after the pullback, the most striking fact remains: silver has more than doubled in 2025.”
— Bart Melek, TD Securities
Silver opens the year below $30 after a volatile 2024
Early momentum as rate cut expectations build
Silver surpasses $49.95, ending 45 years of resistance
CME trading halt sparks speculation; silver surges
Historic psychological barrier falls ahead of Fed meeting
Fed rate cut and Treasury purchases ignite rally to record
The Perfect Storm: Five Forces Driving Silver
1. Five Years of Supply Deficits
The silver market has been running a structural deficit since 2021—and the shortfall is reaching critical levels. According to the Silver Institute, 2025 marks the fifth consecutive year where demand has significantly exceeded supply, with an estimated deficit of 117-206 million ounces.[6]
The cumulative deficit from 2021-2025 now approaches 820 million ounces—roughly equivalent to an entire year of global mine production.[7] This inventory hemorrhage has drained London vault stocks from 31,000 metric tons in 2022 to just over 22,000 by early 2025, while borrowing rates have spiked as high as 200% annualized at peak stress points.[4]
2. Stagnant Mine Supply
Global silver mine production has flatlined at approximately 813-820 million ounces, down 12% from the 2020 peak.[8] The structural problem: roughly 80% of silver is mined as a byproduct of lead, zinc, copper, and gold operations, meaning production responds to those metals’ economics rather than silver prices.
Even with silver above $60, miners can’t simply flip a switch. New projects require 7-10 years from discovery to production, and declining ore grades mean existing mines are becoming less productive.
3. Insatiable Industrial Demand
Silver’s role in the green energy transition has transformed its demand profile. Solar photovoltaic manufacturing alone consumed over 200 million ounces in 2024, with newer high-efficiency cell technologies like TOPCon requiring 50% more silver per panel than previous generations.[9]
Electric vehicles, AI data center infrastructure, and 5G networks are all competing for silver’s unmatched electrical conductivity. Industrial fabrication demand hit a record 680.5 million ounces in 2024 and shows no signs of slowing.[10]
4. Fed Policy Pivot
The Federal Reserve’s dovish turn has been rocket fuel for precious metals. With three rate cuts in 2025 and the unexpected announcement of Treasury purchases, real yields have compressed, making non-yielding assets like silver increasingly attractive.[5]
Speculation about who will replace Jerome Powell—with candidates reportedly favoring even looser monetary policy—has further stoked expectations of prolonged accommodation.
5. Critical Mineral Status
In November 2025, silver was added to the U.S. Geological Survey’s list of critical minerals—a designation that could trigger new trade policies, stockpiling initiatives, and domestic sourcing requirements.[5] China’s announcement of strict export controls on silver for 2026 has added urgency to supply security concerns.
Supply
Demand
Deficit
ETF Inflows: Institutional Money Piling In
Investment demand has surged alongside industrial consumption. Global silver ETF holdings reached 845 million ounces as of December 10—up 18% year-to-date and the highest level since July 2022.[5]
In the first half of 2025 alone, 95 million ounces flowed into silver-backed funds—more than the total inflows for all of 2024. The value of global silver ETF holdings exceeded $40 billion for the first time in June.[11]
This matters because ETF inflows pull physical metal out of circulation, competing directly with industrial users for a shrinking pool of available silver. In a market already operating at a structural deficit, this “paper” demand amplifies physical tightness.
The Gold-Silver Ratio: Historic Compression
One telling indicator of silver’s outperformance is the gold-silver ratio, which measures how many ounces of silver buy one ounce of gold. The ratio has compressed to around 68—its lowest level since 2021 and well below the long-term average of approximately 66.[2]
For context, the ratio exceeded 100 during the March 2020 panic and hovered near 80-85 through much of 2024. The compression suggests silver is finally “catching up” to gold’s rally, a pattern that historically precedes further silver outperformance in bull markets.
Silver Price 2025 Forecast: Analysts Eye $100 Silver
With silver at record highs, forecasts are increasingly bullish—though analysts warn of volatility ahead.
“When undervaluation, deficits as far as the eye can see, and a new industrial revolution meet, market magic happens. That is in a nutshell the story of silver in 2025. We are now in a secular bull market which could well lead us into triple digits over the course of 2026.”
— Philippe Gijsels, Chief Strategy Officer, BNP Paribas Fortis
Not everyone is convinced the rally is sustainable. HSBC’s models, while projecting continued deficits, forecast average prices around $35 for 2025—now looking dramatically conservative with silver trading near $62. The key question: is the market structurally short enough to justify a permanently higher price regime, or will supply eventually catch up?[5]
Risks to Watch
Overbought conditions: Multiple technical indicators show silver in overbought territory. Profit-taking could spark “violent drawdowns,” as BNP Paribas warns, even if the structural bull case remains intact.
Dollar strength: A firmer U.S. dollar typically pressures dollar-priced commodities. Any reversal in the dollar’s recent weakness could cap silver’s gains.
Thrifting and substitution: At $60+ silver, manufacturers face pressure to reduce silver content or find alternatives. Solar panel makers in China are already experimenting with copper metallization as a substitute.
Economic slowdown: A sharp global recession could dampen industrial demand, though silver’s safe-haven appeal might partially offset this.
Key Takeaways:
→ Silver hit an all-time high of $64.64 this week, breaking the 1980 record for the first time in 45 years.
→ Year-to-date gains exceed 115%, more than doubling the price and dramatically outpacing gold’s 60% rally.
→ Five consecutive years of supply deficits have drained ~820 million ounces from global inventories.
→ Industrial demand from solar, EVs, and AI infrastructure shows no signs of slowing.
→ Analyst targets range from $65 (Bank of America) to $100 by 2026 (BNP Paribas), though near-term volatility is expected.
References & Sources
- ts2.tech. “Silver Price Today (December 13, 2025): Spot Silver Holds Near $62 After Record High.” ts2.tech
- CNBC. “Silver has rallied 115% this year. Strategists predict what’s next.” cnbc.com
- Investing News Network. “Silver’s Record-Breaking Surge: Discover the All-Time High Price.” investingnews.com
- Finance Monthly. “Silver Hits $60 Record High in December 2025: What It Means.” finance-monthly.com
- ts2.tech. “Silver Price Today, December 12, 2025: Spot Silver Near Record High Above $64.” ts2.tech
- Carbon Credits. “Silver Price Hits $64 as Supply Deficit Enters Fifth Year.” carboncredits.com
- Silver Institute. “World Silver Survey 2025.” silverinstitute.org
- SunSirs. “Soaring Global Demand Drives Silver to All-Time High.” sunsirs.com
- Sprott Asset Management. “Silver Investment Outlook Mid-Year 2025.” nasdaq.com
- CME Group OpenMarkets. “Silver is Rising: The Key Factors Fueling Demand.” cmegroup.com
- Money Metals. “Silver Investment Surges During First Half of 2025.” moneymetals.com
Disclaimer: This article is for informational purposes only and does not constitute investment advice. Past performance is not indicative of future results. Silver is a volatile asset—always conduct your own research before making investment decisions. BagholderBrief is not a registered investment advisor. Check our full policy -> Legal